

Mastra FactoryFreemium
A shared software factory for coding agents and human reviewers.
HyperProbe: AI Production Debugger & On-Call Agent
AI-native production debugger that captures live variable state without redeploying
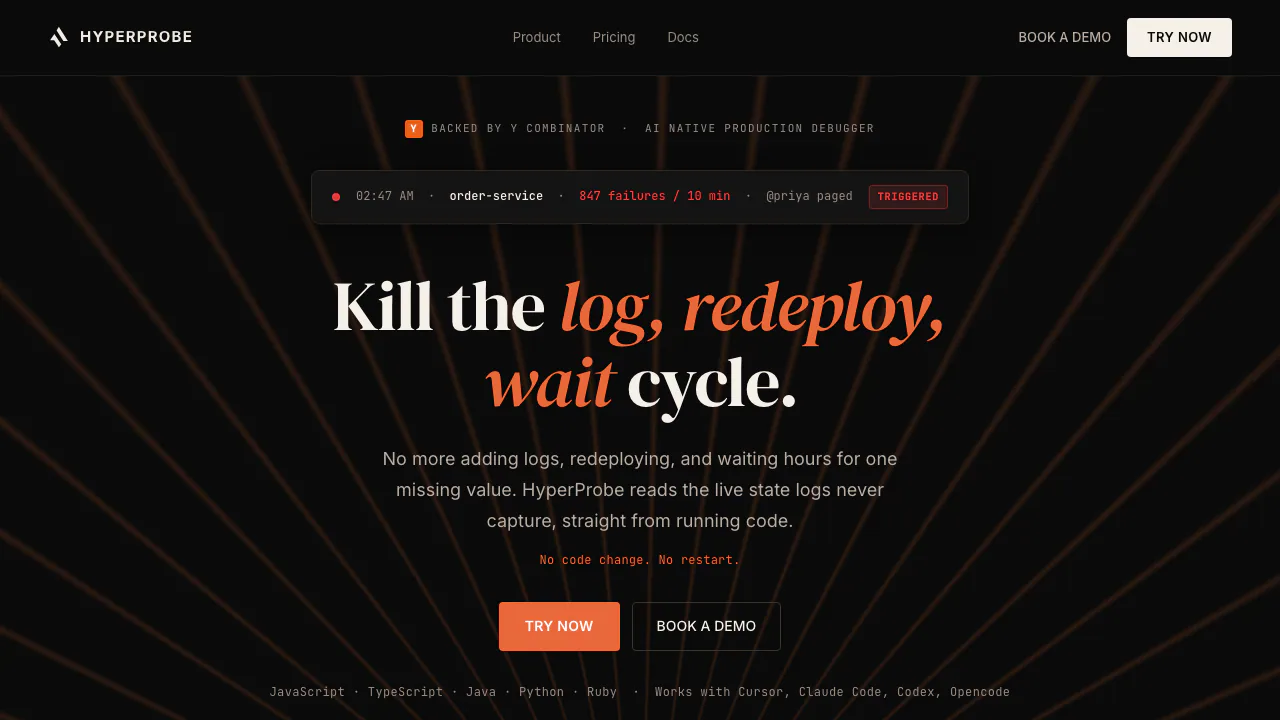
HyperProbe is an AI-native production debugger backed by Y Combinator. It helps backend teams move from alert to confirmed root cause by placing read-only virtual breakpoints on live running code—without redeploying, restarting services, or adding temporary log lines.
What is HyperProbe?
In plain terms, HyperProbe is a tool that lets you (or your coding agent) inspect the actual variable values inside production code while it is running, at the exact line where something went wrong. Traditional logs only show what you remembered to print. HyperProbe captures the live state that logs never recorded: request payloads, intermediate variables, branch decisions, and silent failures that return HTTP 200 with the wrong data.
Think of it as a non-blocking debugger for production. A "probe" fires on real traffic, snapshots the variable tree at a specific line, then disappears. Your service keeps running at full speed—no thread pause, no redeploy cycle, no war room that lasts until sunrise.
Production debugging problems it targets
If your team has ever added console.log, waited 30 minutes for CI/CD, redeployed, and still missed the one value that mattered, HyperProbe is built for that loop. Common pain points include:
- Silent write failures — downstream calls fail quietly while the API returns success.
- Exceptions far from root cause — stack traces point to line 82; the bad value was set at line 18 in another file.
- Swallowed errors — caught exceptions mean no alert, but business metrics drop.
- Race conditions — you need thread state at the exact moment two requests overlap.
- Third-party contract drift — a vendor adds a new status value your parser never handled.
- AI-written code in prod — agents ship fast, but debugging still depends on evidence logs do not contain.
HyperProbe claims teams can shrink time-to-root-cause from hours to minutes and eliminate redeployments per incident when the missing data lives in runtime state, not log text.
Virtual probes: how capture works
A probe is a read-only, non-blocking snapshot of live variable state at a chosen line. Official documentation describes these safety properties:
- Read-only by architecture — probes capture state; they cannot write memory or execute arbitrary code.
- Non-blocking hooks — breakpoints fire asynchronously; requests complete without waiting on capture.
- Bounded lifetime — every probe carries TTL, rate limit, and hit expiry controls you configure.
- PII redaction at the agent — sensitive fields are stripped in-process before payloads leave your container.
- Immutable audit trail — probe placement and captures are logged for review.
On Enterprise, approval gates can be required before a probe arms, and security teams set org-level ceilings on TTL, rate limits, and namespace allow lists.
Supported runtimes today include JavaScript, TypeScript, Java, Python, and Ruby. Go is on the roadmap per the pricing FAQ.
AI on-call workflow: alert to confirmed RCA
HyperProbe integrates with PagerDuty, Datadog, and Slack for alerts, then follows a five-step flow:
- Alert — picks up pages from your existing on-call stack.
- Plan — reads logs and traces to locate suspect files and lines.
- Probe — places a virtual breakpoint on the suspect line without redeploy.
- Capture — fires on live traffic and records exact variable values.
- Confirm — delivers evidence-backed root cause analysis instead of a guess.
The product exposes its debugging engine through an MCP server, so coding agents in Cursor, Claude Code, Codex, and Opencode can place probes, wait for captures, and propose fixes from the same IDE where code is written. You can also use the VS Code extension for manual probe placement.
Documentation describes RCA confidence levels: Confirmed, Probable, or Inconclusive, with captured evidence, limitations, and suggested remediation.
Who HyperProbe is for
HyperProbe targets backend and platform teams running real production traffic—especially teams using AI coding agents who need runtime evidence, not log-only guessing. It fits SRE/on-call engineers, staff engineers debugging cross-service incidents, and security-conscious orgs that need self-hosted or private VPC deployment.
It is likely not the right fit if you have no production services to instrument, only frontend-only apps without a supported SDK runtime, or teams that cannot install an in-process SDK agent.
Setup: SDK, MCP, and time to first capture
Official docs say most teams capture within 15 minutes. Installation is agent-driven: paste one prompt into your coding agent pointing at the installation guide, and the agent installs the SDK, wires the entrypoint, enables source maps, and registers the MCP server.
Architecture has two parts: an in-process SDK agent inside your service, and a broker/control plane (managed cloud or self-hosted) that coordinates probes and stores captures.
Pricing (verified September 2026)
HyperProbe bills per service, never per engineer seat. Probes and captures are unlimited on every plan.
| Plan | Price | Highlights |
|---|---|---|
| Free | $0 forever | 1 service, managed cloud, unlimited probes/captures, 7-day history, MCP server, community support |
| Professional | $99/service/month ($79 annual, 3-service minimum) | Unlimited services, 30-day history, RBAC, Google/GitHub SSO, shared Slack support |
| Enterprise | Custom annual | Self-hosted/private VPC, data residency, approval gates, custom PII rules, SAML/SCIM, named engineer SLA |
First incident assistance is free; cancel any month. See the full pricing page for plan comparison.
Security, privacy, and deployment options
- Managed cloud on Free and Professional; self-hosted or private VPC on Enterprise (Professional: on request).
- Default PII redaction on all plans; Enterprise adds per-field and per-file custom rules.
- Documented overhead: under 1% at 3,000 RPS on reference services; POC includes benchmarking yours.
- Cooldown shields auto-purge probes if event loop lag or memory thresholds are exceeded.
Frequently asked questions
Do I need to redeploy to debug production?
No. HyperProbe injects probes in-process via the SDK. No code change, no restart, no new Docker image for a log line.
Is there a limit on probes or captures?
No metered limits on any plan. Billing is based on how many services you instrument, not debug intensity.
Does HyperProbe work with AI coding agents?
Yes. MCP is included even on the free plan because agents drive the primary workflow through Cursor, Claude Code, Codex, and Opencode.
Can everything run inside our own infrastructure?
Yes on Enterprise—the control plane and capture store run in your VPC and captured values do not leave your network.
Will probes slow down production?
Official materials describe non-blocking, read-only hooks with under 1% overhead at 3,000 RPS on a reference service. Probes auto-expire via TTL, rate limits, and hit caps.
Official resources
Related tools
AI Coding & Developer Tools →
PR LensFreemium
See a pull request’s architecture and data flow before reading the diff.
MonidFreemium
Discover, inspect, and run agent tools through one balance.
Kilo CodeFreemium
An open-source coding agent for IDE, terminal and cloud workflows
RevolteFreemium
Agentic software delivery from engineering intent to reviewed code and production workflows.
Visual Studio CodeFreemium
An extensible code editor with Copilot suggestions, chat and agents