

Mastra FactoryFreemium
Un flusso condiviso per assegnare lavoro agli agenti e verificare il codice.
HyperProbe: debugger IA di produzione e agent on-call
Debugger di produzione nativo IA: snapshot variabili live senza redeploy
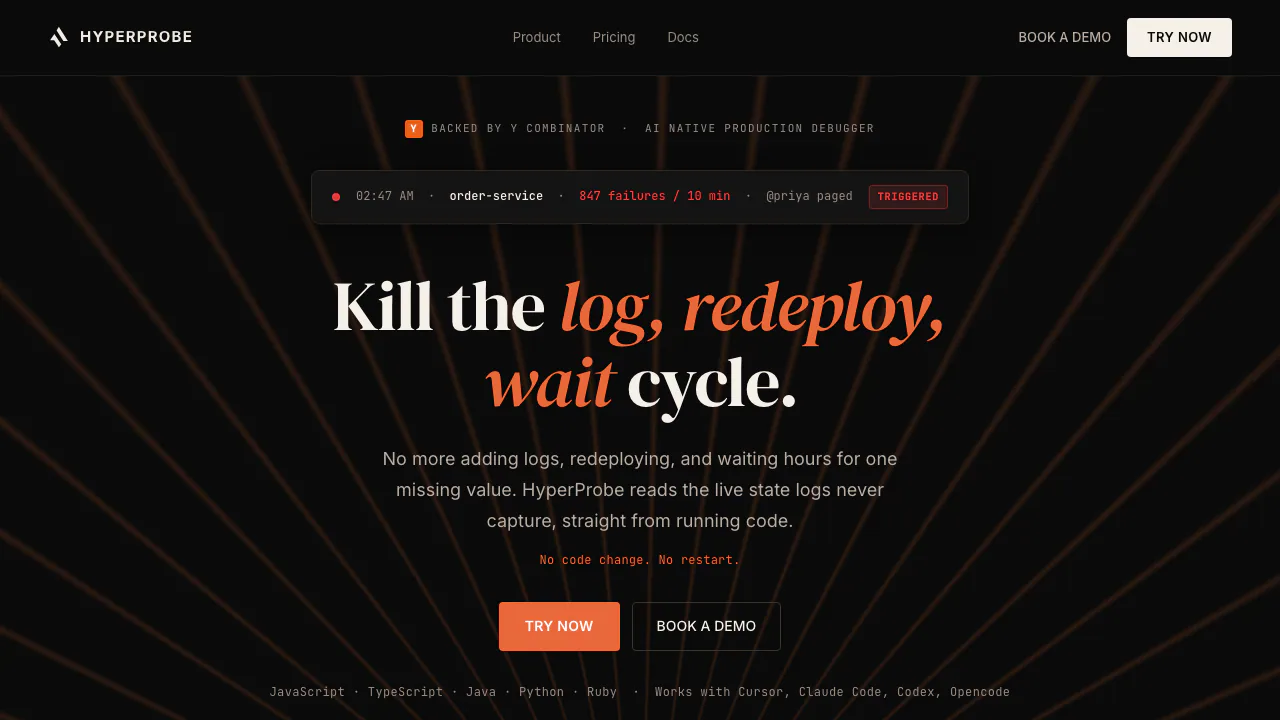
HyperProbe è un debugger di produzione nativo IA, supportato da Y Combinator. Permette ai team backend di passare dall'allerta a una root cause confermata con breakpoint virtuali in sola lettura sul codice in esecuzione, senza redeploy o riavvii.
Cos'è HyperProbe? Spiegato in modo semplice
HyperProbe risponde a: che valore avevano le variabili al momento del fallimento, se i log non lo hanno mai registrato?
Invece del ciclo log → CI/CD → redeploy, una probe cattura lo stato sul traffico reale alla riga sospetta e scompare. Nessuna pausa del thread, nessun impatto utente.
È un debugger non bloccante per la produzione, usabile dagli agenti di coding via MCP (Cursor, Claude Code, Codex, Opencode).
Problemi affrontati
Fallimenti silenziosi, stack trace lontane dalla causa, eccezioni inghiottite, race condition, drift di API di terze parti, codice IA senza evidenze runtime.
Come funzionano le probe
Sola lettura, non bloccanti, con TTL, rate limit e scadenza per hit. PII redatta nell'agent, audit trail immutabile.
Runtime: JavaScript, TypeScript, Java, Python, Ruby.
Flusso agent on-call
Integrazione PagerDuty, Datadog, Slack → piano → probe → capture → RCA confermata.
Prezzi (settembre 2026)
Fatturazione per servizio, probe e capture illimitate.
- Free: $0, 1 servizio, cloud gestito, 7 giorni storico, MCP incluso
- Professional: $99/servizio/mese ($79 annuale, min. 3 servizi)
- Enterprise: custom, self-hosted/VPC, approval gates
Vedi prezzi.
FAQ
Serve un redeploy per debuggare?
No. Il SDK inietta le probe in-process.
Limiti sulle probe?
No — si paga per servizi strumentati.
Tutto on-prem?
Sì in Enterprise nella vostra VPC.
Risorse ufficiali
Installation and first capture
Paste one prompt into your coding agent with the installation guide. The agent installs the in-process SDK, wires your entrypoint, enables source maps, and registers the MCP server. Official docs target 15 minutes to first capture. Architecture: SDK agent inside your service plus a broker/control plane (managed or self-hosted).
Integrations: PagerDuty, Datadog, Slack for alerts; Cursor, Claude Code, Codex, Opencode via MCP for agent-driven debugging; VS Code extension for manual probes.
Comparison: with vs without HyperProbe
Without HyperProbe, engineers grep logs, add print statements, wait for CI/CD, redeploy, and hope the failure reproduces—often 2+ hours for a one-line fix. With HyperProbe, the agent locates the frame, places a probe in background, captures on next matching request, and confirms RCA in under 10 minutes in published examples—without redeploy cycles.
More FAQ
What counts as one service?
One application with the SDK installed. Forty Kubernetes pods still count as one service. HyperProbe does not bill per host, container, traffic volume, or seat.
Can we start managed and move to self-hosted?
Yes. The SDK is identical; self-hosted changes where the control plane runs, not your instrumentation.
Which alert sources are supported?
PagerDuty, Datadog, and Slack per the product website. The agent reads logs and distributed traces to plan probe placement.
Does HyperProbe replace observability tools?
No. It complements logs and traces by capturing variable state those signals miss—especially silent failures and logic bugs without exceptions.
Strumenti correlati
Strumenti di codifica e sviluppo AI →
PR LensFreemium
Vedi architettura e flusso di una pull request prima del diff.
MonidFreemium
Scopri, controlla ed esegui tool con un unico saldo.
Kilo CodeFreemium
Agente open source per IDE, terminale e cloud
RevolteFreemium
Consegna software con agenti, dall’intento a modifiche verificabili.
Visual Studio CodeFreemium
Editor di codice estendibile con suggerimenti, chat e agenti Copilot